
When Business Intelligence Leaders Need Executive Presentations That Drive Clear Capital Allocations
Data Analytics & Business Intelligence (BI) Presentation Design is the strategic visual structuring and design of technical analytics frameworks, data engineering roadmaps, and business intelligence solutions into actionable PowerPoint decks for executive decision-makers.
Presentation Gurus serves as the dedicated presentation design partner for Data Analytics & Business Intelligence (BI) companies, internal data teams, and enterprise analytics vendors. We engineer custom communication tools that solve specific industry sales and governance hurdles, whether you are pitching an Enterprise Data Governance Pitch-Deck to executive board members or presenting a Data Architecture & Lakehouse Pitch-Deck to technical evaluation teams. Business decision-makers hire our team to transform complex data engineering concepts into compelling visual arguments. We craft structured business intelligence slide decks, investor presentations, and product demonstration materials that maintain strict visual hierarchy and corporate brand alignment. Every presentation, pitch deck, and PowerPoint asset we deliver is built to help BI leaders convert technical depth into enterprise contracts and board-level budget approvals.
Why Data Analytics & Business Intelligence (BI) Presentations Need Professional Presentation Design
Data Analytics & Business Intelligence (BI) teams face an ongoing operational challenge: complex analytical models, data architecture initiatives, and predictive insights are frequently misunderstood by executive buyers and steering committees. Standard static reporting decks present isolated metrics without explaining business impact, leading to delayed software approvals, reduced project budgets, and stalled enterprise deployments. Strategy-led presentation design solves this problem by structuring data into clear logical narratives that connect technical architecture to financial performance. Instead of overwhelming audiences with unfiltered dashboard screenshots and dense schema diagrams, a strategic approach isolates primary business drivers, establishes transparent metric definitions, and visualizes projected ROI. The market requires presentation structures that allow board members and enterprise clients to immediately evaluate capital requirements and operational outcomes. The measurable outcome is faster governance sign-offs, reduced sales cycles for BI vendors, and immediate enterprise buy-in for internal data transformation initiatives.
How Working With Us Works
From First Conversation To Finished Deck
Company
Meet JR, our founder. Fortune 500s, SMBs, startups — he’s built presentations for all of them with his team for the past 30 years, and he’s ready to build yours.
Service
Find your fit. We match the right service and scope to your audience, your goals, and your deadline, from 24-hour service to a 15-day turnaround.
Cost
Know the number upfront. Transparent, flat pricing before we start — no surprises, no hidden hours. All from $49 per slide.
Get Started
Tell us about your presentation project. It will take two minutes and we’ll get back to you on our next business day.
















13 Essential Presentation Types for Data Analytics & Business Intelligence (BI)
Data Analytics Strategy & Executive Roadmap Presentation
Primary Audience: Chief Executive Officer, Chief Information Officer, and Board Members.
Purpose: Secure executive mandate and capital expenditure for enterprise analytics modernization.
Description: The Data Analytics Strategy & Executive Roadmap Presentation outlines enterprise data modernization initiatives for senior business leaders. The deck structures multi-year technology investments, data governance milestones, and expected operational efficiencies. Visual layouts communicate maturity models, infrastructure cost projections, and departmental rollout timelines clearly.
Business Intelligence Platform Selection Pitch-Deck
Primary Audience: Enterprise Steering Committees and IT Procurement Directors.
Purpose: Win enterprise BI software vendor selection evaluations.
Description: The Business Intelligence Platform Selection Pitch-Deck evaluates software vendor capability against strict enterprise requirements. The PowerPoint deck details total cost of ownership, deployment architecture, native connectors, and self-service reporting capabilities. Structured comparison tables highlight competitive differentiators, security compliance certifications, and implementation roadmaps.
Enterprise Analytics Pipeline & ETL Architecture Slides
Primary Audience: Chief Technology Officer, Lead Data Architects, and Engineering Managers.
Purpose: Approve data pipeline re-architecture and cloud migration budgets.
Description: The Enterprise Analytics Pipeline & ETL Architecture Slides detail real-time ingestion, transformation layers, and lakehouse storage designs. The presentation visualizes data flow diagrams, schema designs, and latency benchmarks for technical evaluation committees. Specific slides outline performance gains, data quality validation steps, and cloud infrastructure cost optimizations.
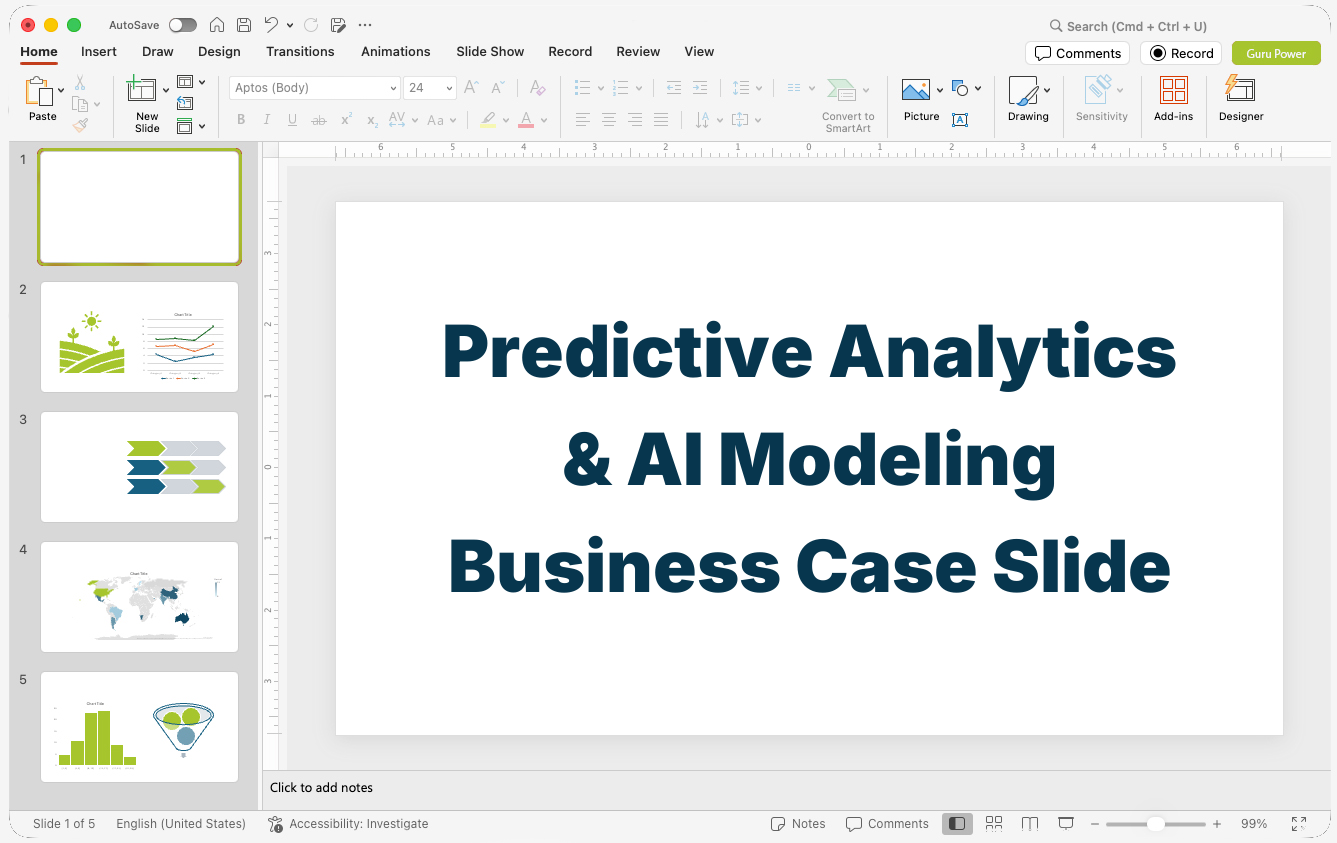
Predictive Analytics & AI Modeling Business Case Slide-Deck
Primary Audience: Department Heads and Operations Vice Presidents.
Purpose: Gain operational buy-in for machine learning integration into business workflows.
Description: The Predictive Analytics & AI Modeling Business Case Slide-Deck links advanced statistical modeling to measurable commercial outcomes. The deck demonstrates model accuracy, training dataset composition, and practical workflow integrations for business stakeholders. Visual graphics compare baseline historical performance against predictive scenario projections.
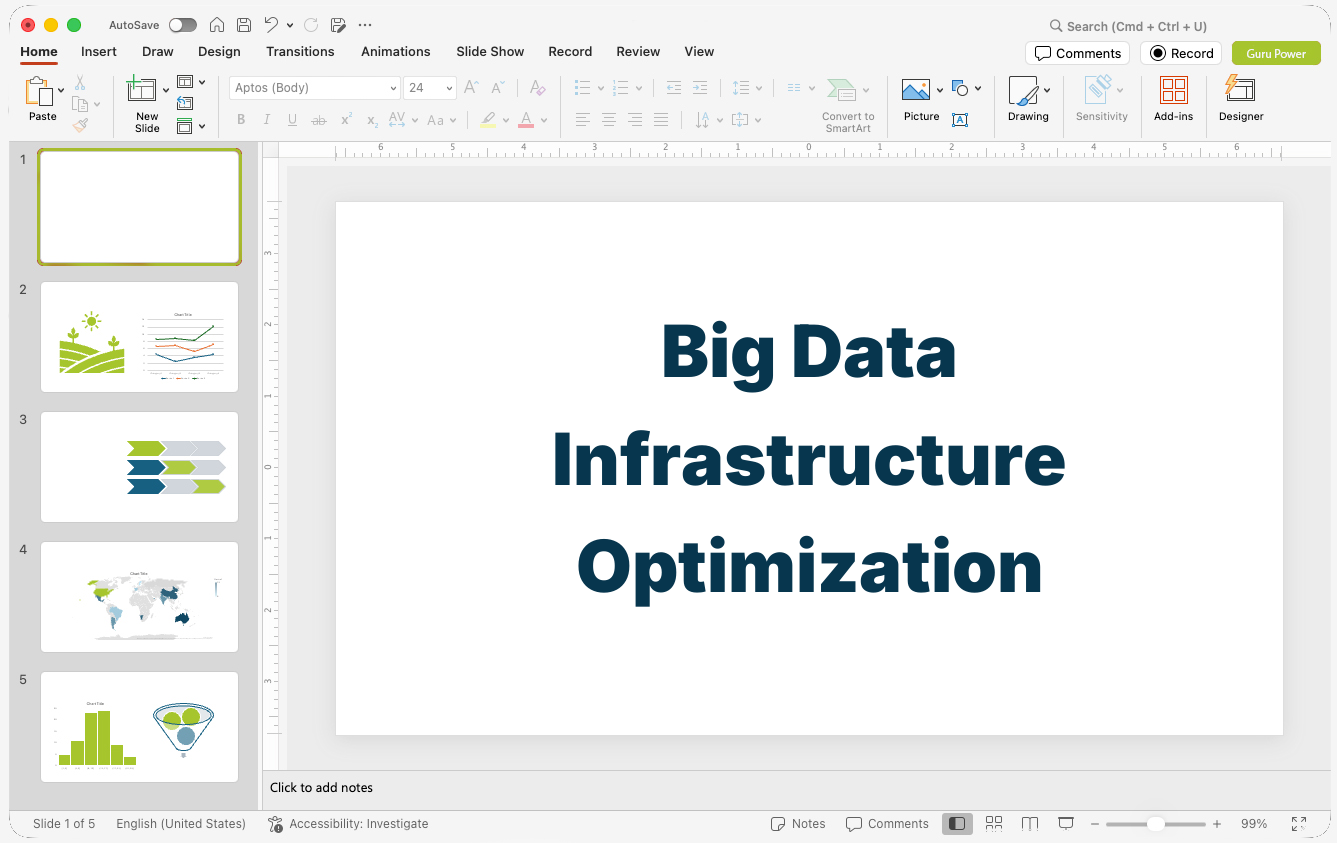
Big Data Infrastructure Optimization Presentation
Primary Audience: Chief Financial Officer and Vice President of Infrastructure.
Purpose: Justify cloud data warehouse spend and compute optimization investments.
Description: The Big Data Infrastructure Optimization Presentation addresses escalating cloud query and storage expenses. The PowerPoint slides detail query performance metrics, warehouse utilization rates, and cost-allocation mechanisms across departments. The pitch demonstrates how query refactoring and automated scaling policies reduce total cloud infrastructure expenditure.
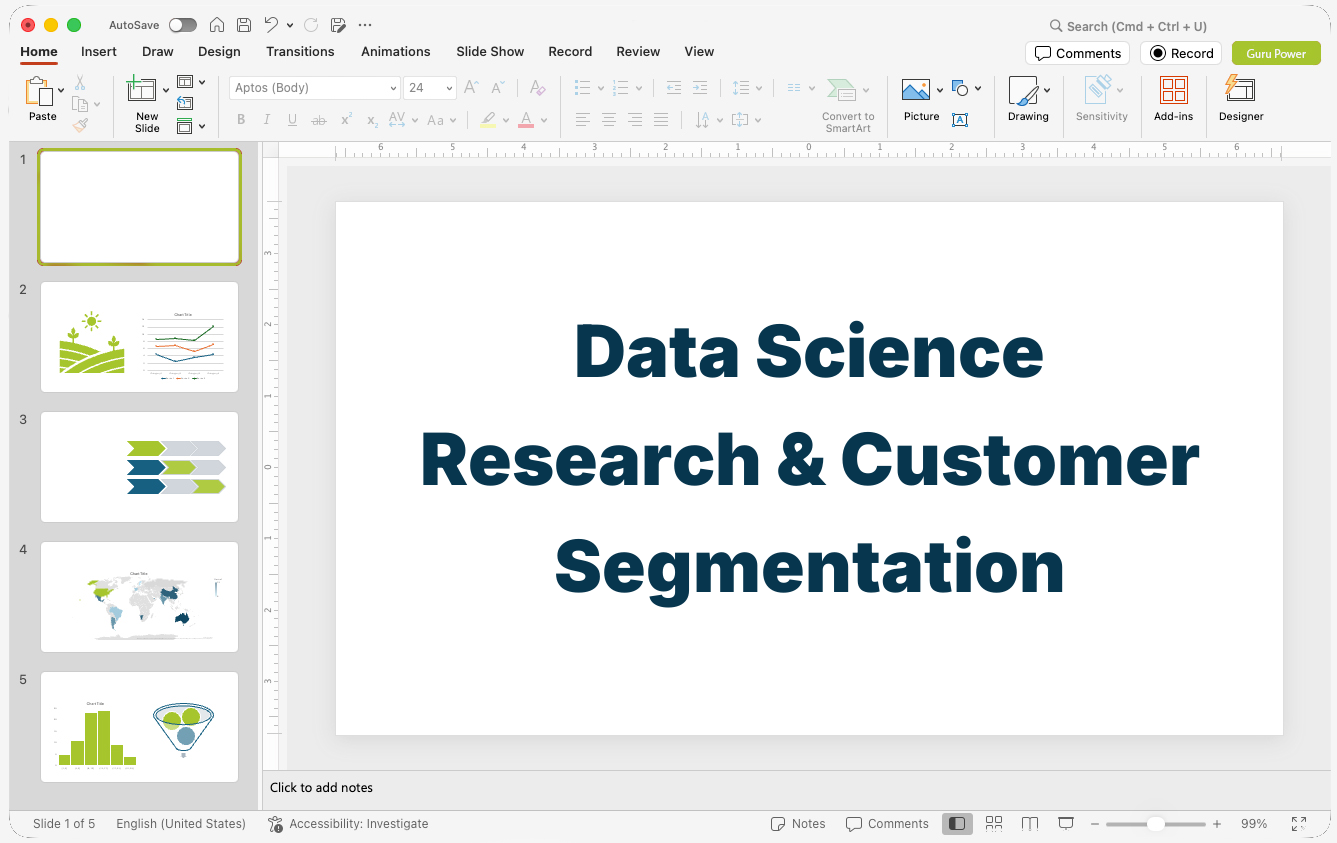
Data Science Research & Customer Segmentation Pitch-Deck
Primary Audience: Chief Marketing Officer and Product Strategy Teams.
Purpose: Adopt algorithmic customer segmentation strategies for marketing campaigns.
Description: The Data Science Research & Customer Segmentation Pitch-Deck presents cluster analysis, behavioral cohort findings, and lifetime value modeling. The slide presentation translates complex statistical clustering methods into actionable target audience profiles. Strategy-led visual layouts outline concrete campaign activation channels for each identified segment.
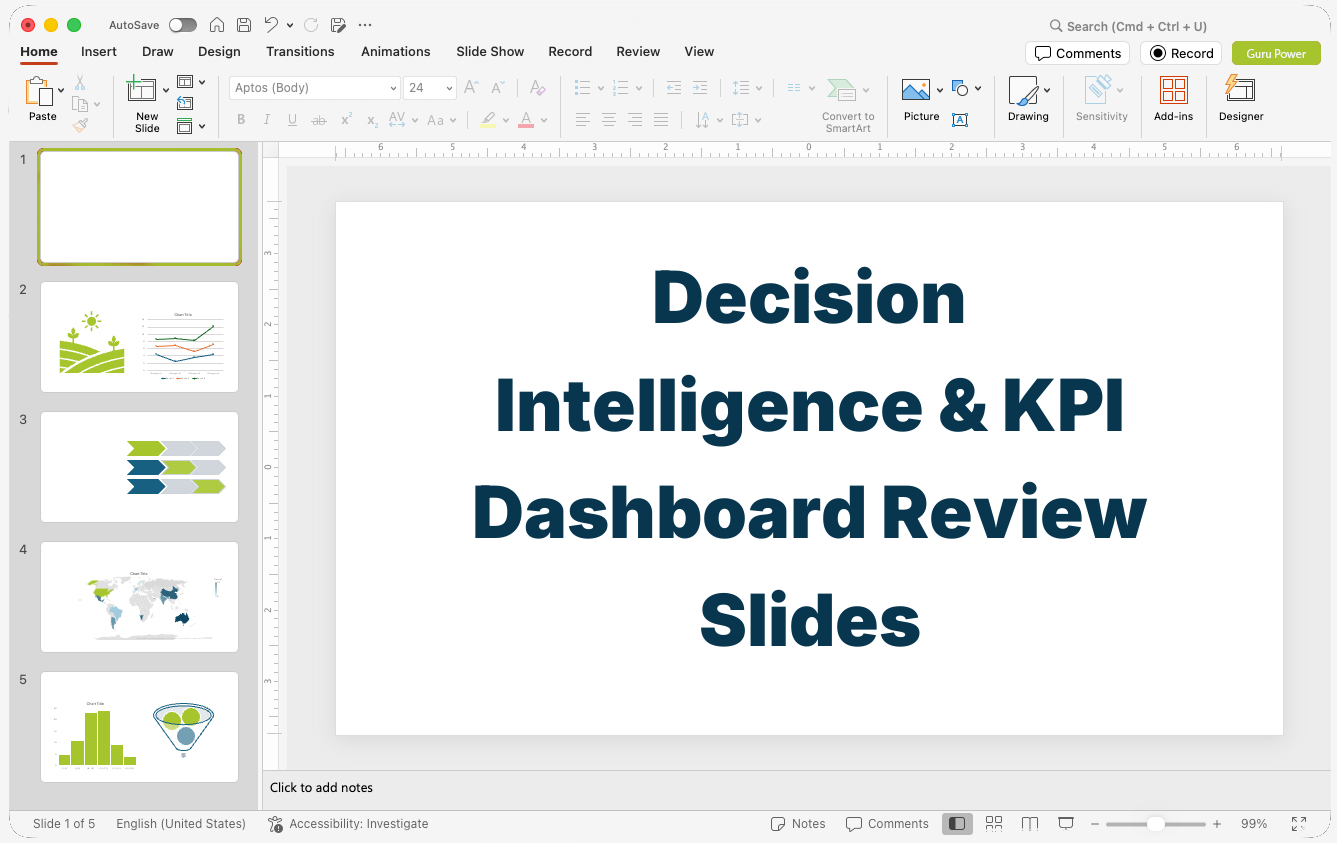
Decision Intelligence & KPI Dashboard Review Slides
Primary Audience: Executive Leadership Team and Business Unit Managers.
Purpose: Establish unified performance indicators and operational reporting cadence.
Description: The Decision Intelligence & KPI Dashboard Review Slides define enterprise metric taxonomies and reporting frameworks. The presentation outlines primary leading and lagging metrics, data ownership roles, and automated reporting schedules. Clear mockups demonstrate executive dashboard layouts across desktop and mobile views.
Enterprise Data Governance & Compliance Presentation
Primary Audience: Chief Risk Officer, General Counsel, and Audit Committees.
Purpose: Approve enterprise data privacy protocols and governance frameworks.
Description: The Enterprise Data Governance & Compliance Presentation details data lineage, role-based access controls, and regulatory compliance standards. The deck maps data handling protocols to regulatory requirements such as GDPR, CCPA, and HIPAA. Structured slides outline risk mitigation workflows, cataloging tools, and automated audit trails.
Business Intelligence Vendor Performance & ROI Review Slide-Deck
Primary Audience: Procurement Officers and Finance Directors.
Purpose: Secure contract renewals for enterprise business intelligence contracts.
Description: The Business Intelligence Vendor Performance & ROI Review Slide-Deck documents the tangible business value delivered by existing BI software deployments. The PowerPoint presentation highlights platform adoption rates, query response times, and user satisfaction metrics across departments. Case studies demonstrate specific operational cost savings achieved through automated reporting.
Data Engineering Team Capability & Services Presentation
Primary Audience: Internal Business Unit Leads and Project Managers.
Purpose: Increase internal utilization of centralized data engineering resources.
Description: The Data Engineering Team Capability & Services Presentation outlines available data transformation, pipeline build, and custom reporting services. The deck clarifies project intake processes, service level agreements, and technical delivery frameworks for internal clients. Visual service catalogs outline standard delivery timelines for custom analytics requests.
Predictive Analytics Demand Forecasting Slide-Deck
Primary Audience: Supply Chain Directors and Inventory Planning Teams.
Purpose: Authorize predictive inventory management system integration.
Description: The Predictive Analytics Demand Forecasting Slide-Deck explains algorithmic inventory optimization models to supply chain leaders. The presentation outlines historical error rates, seasonal trend variables, and projected safety stock reductions. Visual charts demonstrate how automated forecasting reduces stockout risks and working capital requirements.
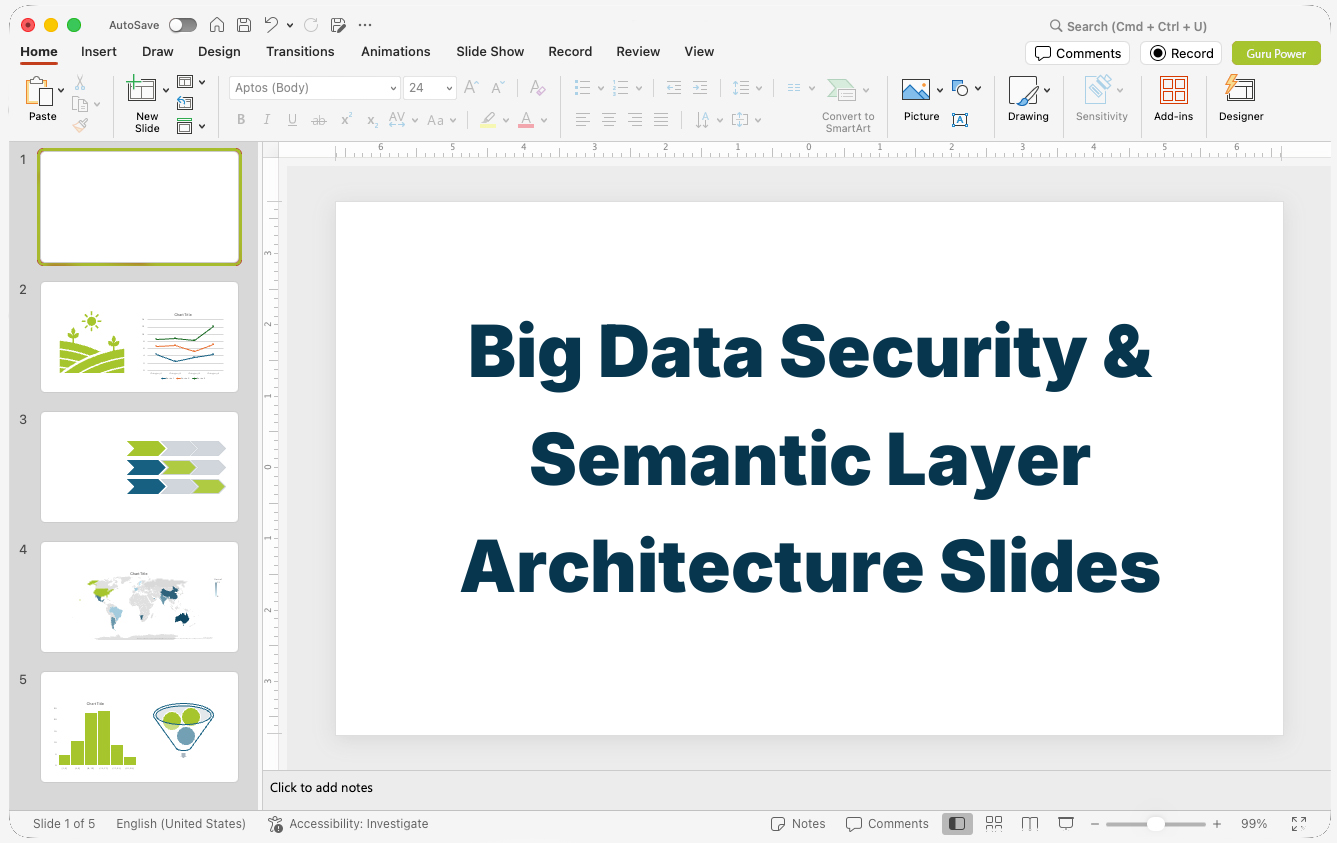
Big Data Security & Semantic Layer Architecture Slides
Primary Audience: Chief Information Security Officer and Enterprise Architects.
Purpose: Pass cybersecurity reviews for centralized semantic layer implementation.
Description: The Big Data Security & Semantic Layer Architecture Slides outline unified business logic definitions and row-level access rules. The slide-deck details single-sign-on integration, data encryption in transit and at rest, and tenant isolation protocols. Precise technical diagrams demonstrate how semantic abstraction prevents unauthorized metric manipulation.
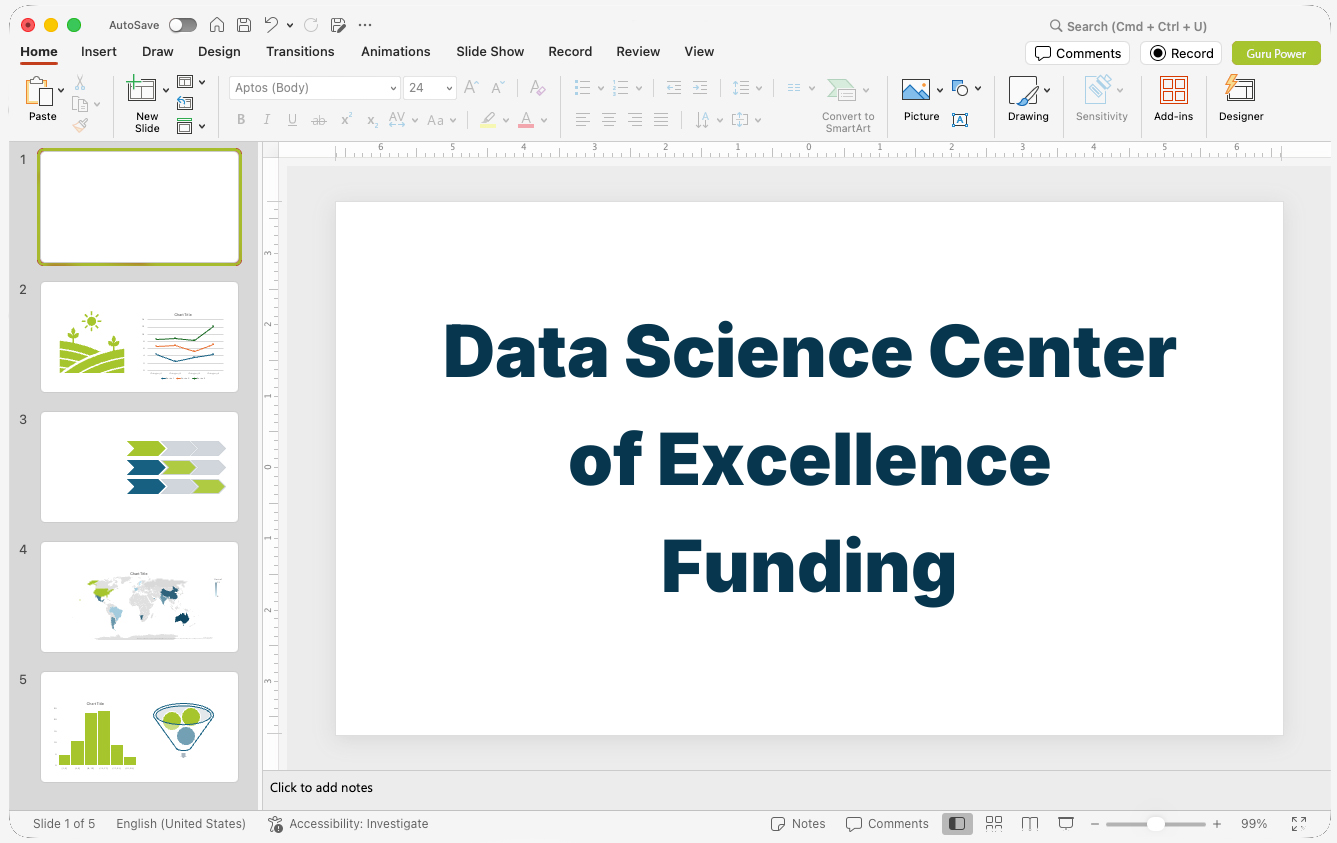
Data Science Center of Excellence Funding Pitch-Deck
Primary Audience: Corporate Strategy Committee and Finance Executives.
Purpose: Secure multi-year funding to centralize enterprise data science operations.
Description: The Data Science Center of Excellence Funding Pitch-Deck outlines the organizational model, talent requirements, and ROI for centralized data science teams. The pitch-deck presents cross-departmental use cases, shared infrastructure savings, and talent retention strategies. Clear financial models project the cumulative return on investment over a three-year horizon.
Your PowerPoint, Google Slide and KeyNote Strategy, Story and Design Professionals
Presentation Gurus solves communication friction for Data Analytics & Business Intelligence (BI) organizations through precise visual engineering, rigorous layout hierarchy, and standardized design systems. We translate raw pipeline metrics, semantic layer models, and complex analytics workflows into intuitive visual structures that align diverse technical and non-technical stakeholders. Our designers enforce complete brand consistency across every slide deck and PowerPoint template, ensuring your executive team presents cohesive, institutional-grade deliverables. By combining analytical rigor with strategic presentation design, we eliminate misaligned messaging and clarify project ROI for decision-makers. Contact Presentation Gurus today to review your existing presentation materials and request a custom scope for your next data analytics project.
Ready ToGet Started?
Questions & Answers
Data Analytics & Business Intelligence (BI) Presentations FAQs
How does the collaboration process work?
Everything happens online. Every meeting is a Microsoft Teams call or similar virtual environment where we can share desktops and information in real time. Revision meetings and discovery calls are always scheduled in the morning, so by noon we can begin work on tasks for the next revision meeting.
How do you explain technical BI architecture to non-technical executive board members?
We isolate operational capabilities and commercial outcomes from underlying code and backend infrastructure. The presentation structure uses visual abstraction layers, replacing dense pipeline diagrams with functional workflow maps. This addresses board questions regarding cost, security, and time-to-value while preserving technical detail in optional appendix slides.
How long does it take to get a presentation designed?
If your team needs a complete presentation by 9:00 AM the next day, we can meet that deadline. Most projects take 10 – 15 days, providing we have all the information. Pricing is also based on slide complexity and speed — a basic slide deck with a 15-day delivery costs much less than a premium slide deck delivered the next morning.
Does our industry need a Presentation or a Pitch Deck?
The terms are frequently used interchangeably, but they serve different strategic purposes. A pitch deck is a highly visual, persuasive tool designed to secure a strategic commitment or investment. A standard presentation is an informative, detailed document structured to align stakeholders and share data.
Can you standardise PowerPoint templates for enterprise data science teams?
Yes, we construct modular PowerPoint design systems built for data teams. These templates include pre-formatted slide layouts for metric dashboards, ETL flowcharts, predictive model outputs, and project roadmaps, enabling internal teams to produce brand-compliant, structured presentations quickly.
What does Data Analytics & Business Intelligence (BI) Presentations presentation design cost?
Pricing is simple and clear. A basic slide design or redesign begins at $49 per slide. Premium presentation design, which includes copywriting and basic storytelling, starts at $79 per slide. Custom presentations involving strategy, copywriting and custom graphics are quoted based on your specifications. See complete pricing details here.
Will our team receive the fully editable source file?
Yes. Unlike graphic designers who deliver flat PDFs or JPEGs, Presentation Gurus delivers the native, fully editable presentation file (.pptx, .key, etc.) so your team can make last-minute text edits on the fly, or update the presentation later as details change.
We have sensitive business information. Can you work under an NDA?
Virtually all of our client work is done under an NDA. We have a basic NDA included with our presentation work order, plus an enhanced, expanded non-disclosure agreement available whenever a project calls for it.
Why hire a specialized presentation design firm for data analytics slide decks?
Generalist designers often simplify technical graphics incorrectly, altering key metric relationships or distorting data visualization standards. A specialized design firm understands business intelligence frameworks, semantic data modeling, and reporting taxonomies, ensuring visual precision, logical hierarchy, and immediate credibility with technical evaluators.
How do you handle sensitive customer metrics during the presentation design process?
We operate under non-disclosure agreements and utilize anonymized synthetic datasets during the design and layout phase. All original client data fields, proprietary calculations, and internal identifiers are masked or sanitized before graphic processing.
Presentation Gurus' research identifies 15 locations with active Data Analytics & Business Intelligence (BI) operations, including San Francisco, CA, Seattle, WA, and New York, NY.
Modern business intelligence operations power critical decisions across major commercial hubs. In San Francisco, CA, cloud database platforms and BI leaders like Salesforce, Databricks, and Snowflake shape modern data stacks. Further north, Seattle, WA acts as a global center for enterprise analytics heavyweights Microsoft Power BI and Amazon Web Services. Down the coast, hardware analytics and enterprise data storage providers thrive in San Jose, CA, while San Diego, CA focuses on genomic data analytics, biotechnology BI, and defense engineering.
These technical foundations closely align with adjacent digital infrastructure. Teams working in Cloud Computing Infrastructure (IaaS/PaaS) and DevOps & Cloud Migration Services build the pipelines that feed BI dashboards. Meanwhile, specialists in Cybersecurity & Threat Intelligence protect the integrity of shared metrics. Mountain and central markets add their own specialized capabilities. In Denver, CO, an expanding cluster of SaaS BI and geospatial analytics companies continues to grow. Companies in Austin, TX see steady growth from enterprise BI software divisions and vendors like Oracle, while Dallas, TX leans on extensive enterprise reporting teams and telecom data operations.
This network ties into broader technical ecosystems, including Telecommunications & Network Infrastructure, IT Managed Service Providers (MSPs), and Enterprise Software-as-a-Service (SaaS). Sector-specific analytics also shape major regional markets throughout the Midwest. In Chicago, IL, enterprise consulting firms manage complex logistics data and supply chain intelligence. Across the upper Midwest, Minneapolis, MN features a dense base of retail analytics groups driven by regional corporate retail headquarters.
East Coast hubs apply business intelligence to specialized public and private sectors. In New York, NY, financial services analytics firms, BI vendors, and media intelligence agencies turn massive data streams into clear reports. Financial leadership teams often draw on structured frameworks like the Financial Model & Valuation Readout to communicate complex fiscal metrics. South of New York, Philadelphia, PA supports life sciences data science, pharmaceutical analytics, and health BI platforms. That work connects naturally with Boston, MA, which hosts healthcare analytics startups, enterprise software innovators, and university research centers.
Health-focused intelligence links directly to wider market developments in Healthtech & Digital Health Software and learning analytics in Edtech Platform Development. Moving south, Washington, DC generates steady demand for federal data practices, defense contractors, and public sector intelligence. In Raleigh, NC, clinical analytics groups work alongside legacy analytics leader SAS Institute. Meanwhile, Atlanta, GA serves as a core regional center for transaction data, health data systems, and fintech BI. Across all of these sectors, teams rely on assets like the Big Data Analytics & Insights Readout to transform deep numbers into actionable presentation slides.
Data Analytics & Business Intelligence (BI) Presentations By the Numbers
- The global business intelligence and analytics market is estimated to reach $50.4 billion in 2026. (Business Intelligence & Analytics Market Forecast, 2026-2033 – Coherent Market Insights)