
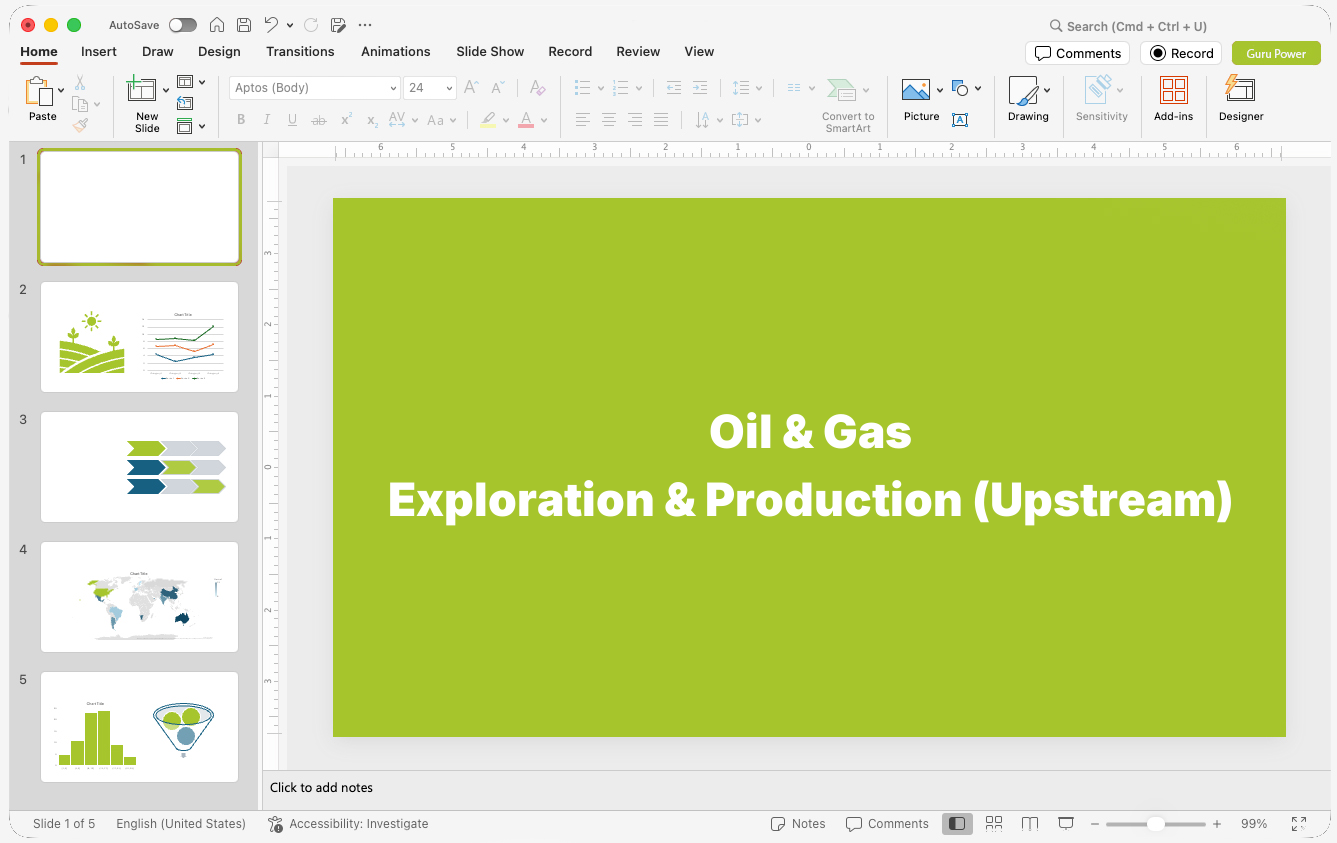
When Oil & Gas Exploration & Production Decision-Makers Need Strategic Presentations Addressing Business Outcomes
Oil & Gas Exploration & Production (Upstream) Presentation Design is the specialized discipline of structuring geological, operational, and financial data into strategic slide decks for energy sector investors, joint venture partners, and regulatory authorities.
Presentation Gurus serves as the dedicated presentation design partner for operators across the Upstream sector. Upstream E&P teams regularly communicate complex asset valuations, regulatory compliance, and field development economics to external capital providers and internal boards. Our team builds technical presentation materials tailored to your specific asset class, whether defending an Unconventional Reservoir Field Development Slide-Deck or detailing an Acreage Acquisition Pitch-Deck. We convert complex reservoir models, lease acreage maps, and drilling economics into actionable executive communications. Whether your leadership requires a board-level capital allocation presentation or an institutional investor pitch deck, we ensure your technical credibility remains intact while framing the visual commercial narrative.
Why Oil & Gas Exploration & Production (Upstream) Presentations Need Professional Presentation Design
The problem is that standard presentations in the E&P sector rely heavily on raw engineering exports, cluttered spreadsheets, and unstructured technical reports. Investors expect clear capital allocation logic, while technical boards demand rigorous geological and reservoir evidence. Standard slide templates fail to bridge this communication gap between subsurface engineers and executive capital committees. Strategy-led design addresses this by structuring complex field development plans, decline curves, and EUR metrics into clear executive narratives. Visual hierarchy elevates key financial returns alongside technical validation, replacing visual noise with decisive data. This addresses investor skepticism, stream-lines JV approvals, and accelerates capital deployment decisions.
How Working With Us Works
From First Conversation To Finished Deck
Company
Meet JR, our founder. Fortune 500s, SMBs, startups — he’s built presentations for all of them with his team for the past 30 years, and he’s ready to build yours.
Service
Find your fit. We match the right service and scope to your audience, your goals, and your deadline, from 24-hour service to a 15-day turnaround.
Cost
Know the number upfront. Transparent, flat pricing before we start — no surprises, no hidden hours. All from $49 per slide.
Get Started
Tell us about your presentation project. It will take two minutes and we’ll get back to you on our next business day.










13 Essential Presentation Types for Oil & Gas Exploration & Production (Upstream)
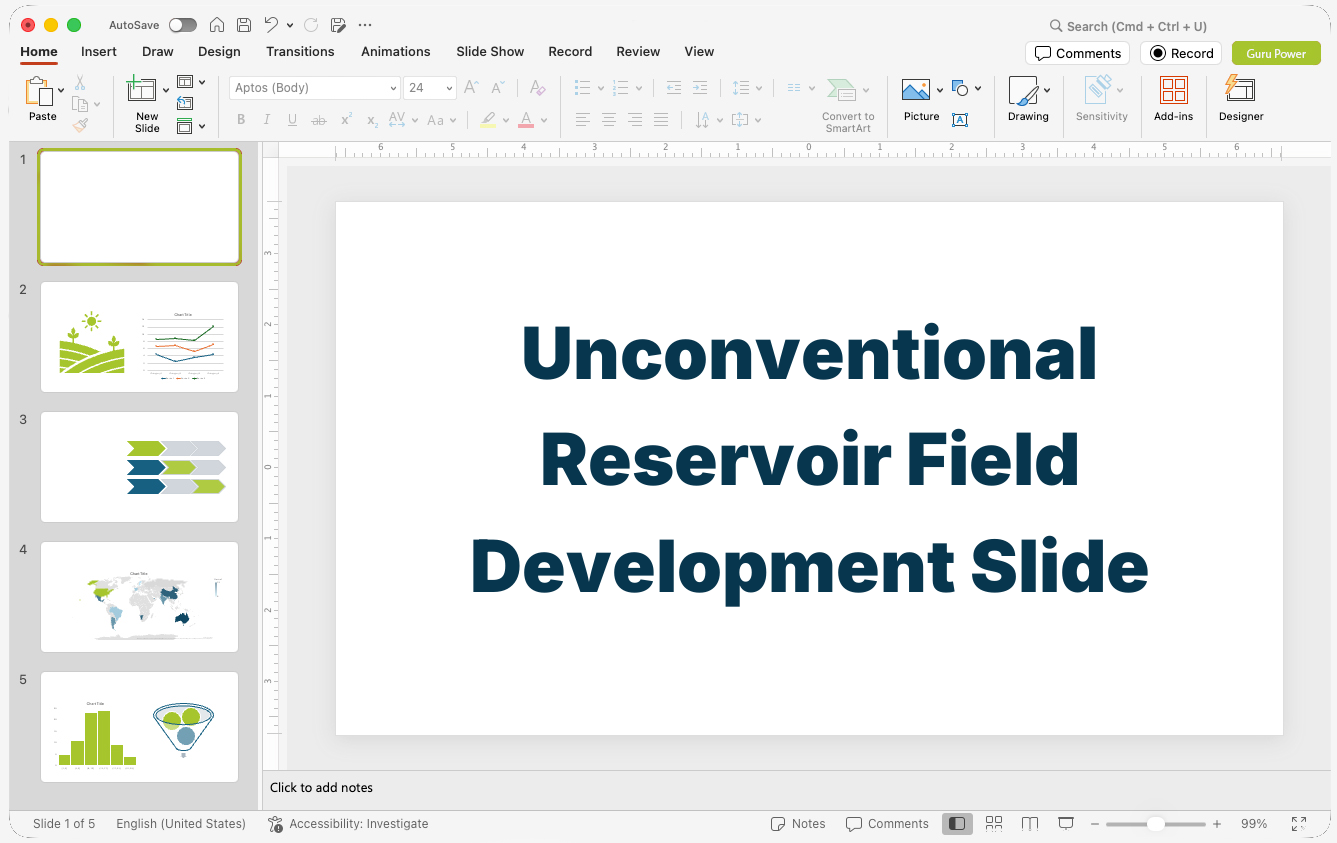
Unconventional Reservoir Field Development Slide-Deck
Primary Audience: Investment Committees and Executive Management.
Purpose: Secure capital authorization for multi-well pad drilling campaigns..
Description: This presentation structures multi-well pad drilling schedules, lateral length optimizations, and completion designs. The data shows estimated ultimate recovery (EUR) projections across target shale formations alongside capital deployment timelines. The market requires clear capital efficiency metrics before approving multi-rig commitments.
Acreage Acquisition Pitch-Deck
Primary Audience: Institutional Private Equity Investors and Bank Lenders.
Purpose: Raise debt or equity capital to acquire undeveloped leasehold acreage..
Description: The problem is proving asset upside in proven producing basins while maintaining conservative pricing assumptions. This slide deck outlines net revenue interest, contiguous lease positions, and offset operator production data. Investors expect clear breakeven oil prices and inventory depth charts.
Joint Venture Farm-In Presentation
Primary Audience: Target Working Interest Partners.
Purpose: Execute farm-out agreements to share exploration risk and capital costs..
Description: Operators use this deck to detail working interest terms, carry structures, and operator responsibilities. Industry requirements mandate clear subsurface structural maps, seismic analysis, and dry-hole risk assessments. The presentation provides visual clarity on cash flows and drilling risk profiles.
Annual Reserves Replacement PowerPoint
Primary Audience: Board of Directors and SEC Compliance Reviewers.
Purpose: Validate year-end proved reserves additions and reserve replacement ratios..
Description: This presentation delivers a audited review of Proved Developed Producing (PDP) and Proved Undeveloped (PUD) reserves. Competitors present similar reserve audits, requiring clear presentation of finding and development (F&D) costs. The slides present third-party engineer audit summaries alongside SEC pricing sensitivity models.
Offshore Exploration Rig Proposal Slides
Primary Audience: Joint Venture Operating Committees.
Purpose: Approve deepwater drilling commitments and rig charter contracts..
Description: This deck highlights subsea geological structures, water depth considerations, and rig safety specifications. Customers need precise operational risk mitigation frameworks and logistics plans for offshore campaigns. The presentation details authorization for expenditure (AFE) budgets and well control provisions.
E&P Sector Secondary Equity Offering Pitch-Deck
Primary Audience: Institutional Energy Investors and Equity Underwriters.
Purpose: Raise public capital to fund enterprise debt reduction or asset expansion..
Description: This pitch deck targets institutional fund managers by highlighting free cash flow yield, leverage ratios, and dividend policy resilience. The market requires transparency on capital discipline and reinvestment rates. The presentation correlates operational efficiency gains with corporate valuation metrics.
Enhanced Oil Recovery Feasibility Presentation
Primary Audience: Asset Capital Allocation Committees.
Purpose: Fund secondary recovery injection infrastructure in mature oilfields..
Description: This technical presentation details reservoir pressure maintenance through waterflood or carbon dioxide injection modeling. Industry requirements mandate thorough sweep efficiency estimates and incremental oil recovery profiles. The presentation justifies required surface facility capital expenditures.
Asset Divestiture Information Memorandum Slides
Primary Audience: Qualified Transaction Bidders and M&A Advisors.
Purpose: Maximize asset sale value during competitive asset auction processes..
Description: This slide deck outlines producing well counts, current daily throughput, and remaining inventory locations for non-core assets. Competitors present robust cash flow histories to justify high deal multiples. The presentation highlights infrastructure access and gathering netbacks.
Petroleum Exploration Geological Technical Review
Primary Audience: Chief Geologists and Corporate Exploration Managers.
Purpose: Approve exploration block seismic acquisition and wildcat well targets..
Description: This technical PowerPoint presents 3D seismic processing, source rock maturity, and trap mechanics across frontier acreage. Technical teams need explicit fault seal risk analysis and hydrocarbon column height estimates. The slides frame risk-weighted resource estimates against lease retention deadlines.
Workover & Well Intervention Strategy PowerPoint
Primary Audience: Operations Vice Presidents and Production Engineers.
Purpose: Secure operational budget for artificial lift optimization and recompletions..
Description: This presentation outlines artificial lift upgrades, pump card analysis, and re-fracturing potential in declining wells. Operational reality mandates lowering lifting costs per barrel across mature assets. The slides detail pay-back periods and rate of return thresholds for well intervention programs.
Upstream Sector HSE & Operational Safety Review
Primary Audience: Regulatory Inspectorates and Corporate Safety Boards.
Purpose: Demonstrate compliance with environmental standards and safety targets..
Description: This slide deck presents Total Recordable Incident Rates (TRIR), methane emission reductions, and flaring intensity metrics. Regulatory mandates dictate strict environmental baseline monitoring and spill mitigation protocols. The presentation proves operational compliance and risk management discipline.
Midstream & Gathering Connection Proposal Slides
Primary Audience: Commercial Pipeline Operators and Gathering Partners.
Purpose: Negotiate favorable takeaway capacity and gas processing agreement terms..
Description: This presentation presents regional field production forecasts, gas composition analysis, and minimum volume commitments. Operators need reliable gathering and processing infrastructure to avoid well shut-ins. The slides compare transport tariff impacts on wellhead netback economics.
Oil & Gas Operators Investor Day Slide-Deck
Primary Audience: Equity Research Analysts and Institutional Shareholders.
Purpose: Communicate long-term corporate strategy, capital returns, and asset runway..
Description: This comprehensive presentation covers multi-year production guidance, inventory depth, and return of capital strategies. Investors expect sustainable balance sheet strength and disciplined capital allocation. The deck connects basin-level operational performance to enterprise cash flow generation.
Your PowerPoint, Google Slide and KeyNote Strategy, Story and Design Professionals
Presentation Gurus delivers end-to-end design, narrative structuring, and visual standardization tailored to E&P workflows. We transform raw technical charts, seismic interpretations, and economic models into professional visual narratives that maintain absolute technical accuracy. Our team enforces brand consistency across technical engineering reviews and investor pitch presentations alike, eliminating fragmented formatting across asset teams. To discuss transforming your asset economics and field data into clear executive slide decks, contact Presentation Gurus today.
Ready ToGet Started?
Questions & Answers
Oil & Gas Exploration & Production (Upstream) Presentations FAQs
How do you handle complex technical E&P data in PowerPoint slide decks?
We maintain technical precision by converting raw well log curves, decline charts, and acreage maps into clear vector visuals. Complex numerical tables are re-formatted with visual emphasis on key financial and volumetric outputs, ensuring both technical experts and non-technical board members quickly grasp the core asset metrics.
Will our team receive the fully editable source file?
Yes. Unlike graphic designers who deliver flat PDFs or JPEGs, Presentation Gurus delivers the native, fully editable presentation file (.pptx, .key, etc.) so your team can make last-minute text edits on the fly, or update the presentation later as details change.
How does the collaboration process work?
Everything happens online. Every meeting is a Microsoft Teams call or similar virtual environment where we can share desktops and information in real time. Revision meetings and discovery calls are always scheduled in the morning, so by noon we can begin work on tasks for the next revision meeting.
How long does it take to get a presentation designed?
If your team needs a complete presentation by 9:00 AM the next day, we can meet that deadline. Most projects take 10 – 15 days, providing we have all the information. Pricing is also based on slide complexity and speed — a basic slide deck with a 15-day delivery costs much less than a premium slide deck delivered the next morning.
Can your agency sign a non-disclosure agreement before reviewing asset data?
Yes. Upstream operators handle non-public reservoir data, lease acreage, and unannounced acquisition targets. We execute mutual non-disclosure agreements prior to reviewing any proprietary field development or geological data.
We have sensitive business information. Can you work under an NDA?
Virtually all of our client work is done under an NDA. We have a basic NDA included with our presentation work order, plus an enhanced, expanded non-disclosure agreement available whenever a project calls for it.
Does our industry need a Presentation or a Pitch Deck?
The terms are frequently used interchangeably, but they serve different strategic purposes. A pitch deck is a highly visual, persuasive tool designed to secure a strategic commitment or investment. A standard presentation is an informative, detailed document structured to align stakeholders and share data.
What does Oil & Gas Exploration & Production (Upstream) Presentations presentation design cost?
Pricing is simple and clear. A basic slide design or redesign begins at $49 per slide. Premium presentation design, which includes copywriting and basic storytelling, starts at $79 per slide. Custom presentations involving strategy, copywriting and custom graphics are quoted based on your specifications. See complete pricing details here.
Do you offer custom graphics for subsurface geology and drilling architecture?
Yes. We create clear custom vector diagrams illustrating horizontal well spacing, hydraulic fracturing stages, offshore production structures, and facility processing flowcharts aligned to your technical specifications.
What turn-around time should E&P teams expect for an institutional pitch deck?
Typical timelines range from 10 to 15 business days depending on slide count and custom illustration requirements. Expedited delivery schedules are available for time-sensitive A&D transactions, farm-in negotiations, or emergency board reviews.
Presentation Gurus' research identifies 13 locations with active Oil & Gas Exploration & Production (Upstream) operations, including Houston, TX, Midland, TX, and Oklahoma City, OK.
Upstream energy operations rely on distinct hubs across North America to manage complex assets. In Texas, corporate and field coordination divide naturally by basin. Houston, TX acts as the global headquarters hub for major international operators and oilfield service providers. Out west, Midland, TX serves as the primary operational center driving Permian Basin extraction. Regional capital and independent producers gather in Dallas, TX, backed by active private equity sponsors. Nearby, Fort Worth, TX maintains its role as an operating center for Barnett Shale gas assets, while San Antonio, TX manages field logistics and exploration for the Eagle Ford Shale.
Drilling and production activity extends north through the Mid-Continent and Rocky Mountains. Oklahoma City, OK anchors operators focused on the SCOOP and STACK plays, reinforcing why Oklahoma counts oil and gas firms like Devon Energy among its primary economic drivers. In Tulsa, OK, mid-sized producers work alongside technical teams specializing in petroleum engineering and geology. Further north, Denver, CO functions as the regional headquarters for teams active across the DJ Basin and the Bakken. That resource footprint connects closely with Wyoming, where oil, natural gas, and broader resource extraction form the backbone of the economy.
Specialized recovery efforts span from coastal waters to the far north. In the Gulf of Mexico, deepwater exploration and offshore platforms run through teams in New Orleans, LA. Natural gas operators also maintain offices in Shreveport, LA to support drilling across the Haynesville Shale. Further north, Pittsburgh, PA provides a corporate base for natural gas developers in the Appalachian Marcellus Shale. On the West Coast, Bakersfield, CA leads operations for thermal heavy oil recovery. Up in Anchorage, AK, corporate teams steer North Slope development, cementing Alaska as a vital region for crude oil production.
Upstream producers frequently plan capital programs using frameworks detailed in our Operational & Product Roadmap guide. Their operational demands also overlap with adjacent industrial markets. Field production coordinates closely with Warehousing & Distribution Centers to stage equipment, alongside Third-Party Logistics (3PL) & Freight Forwarding networks that haul pipe and tools. Offshore rigs and international shipments interface with Maritime Freight & Ocean Shipping Lines, while site teams turn to Environmental & Waste Management Services and Water & Wastewater Utilities to handle produced water and drilling byproducts.
Broader energy strategies often intersect as traditional producers invest in modern alternatives. Upstream operators increasingly work alongside Clean Tech & Carbon Capture Solutions to manage emissions from field activities. These operators also study project models from Nuclear Power Generation & Services and balance their asset mix with Renewable Energy Development (Solar, Wind, Hydro). Bringing these technical and commercial storylines together clearly is the central mission of every presentation designer on our team.
Oil & Gas Exploration & Production (Upstream) Presentations By the Numbers
- U.S. crude oil production reached a record average of 13.6 million barrels per day in 2025. (The United States produced more crude oil than any other country in 2025 – U.S. Energy Information Administration (EIA))
- The Permian Basin region accounted for 48% of total U.S. crude oil production in 2025. (U.S. crude oil production rose in 2025, setting new record – U.S. Energy Information Administration (EIA))